

HBcontrol: Objective, Measurable and Actionable Visual Inspections
In public environments, hygiene needs to be impeccable. Yet inspections still often rely on personal impressions — depending on who’s looking, when, or where, results can vary.
The outcome? It becomes difficult to compare inspections or justify improvements.
HBcontrol brings clarity to it all.
It transforms observations into clear, measurable and actionable data — even before issues become visible.

Key Benefits
Rate each criterion using a structured evaluation grid
Track quality evolution over time
Automatically generate detailed numerical results
Add comments and photos (unlimited)
Available in 3 languages (French, English, and Spanish

Charts That Drive Smarter Decisions
With HBcontrol, you can easily identify trends, detect common issues and spot high-risk areas:
-
Quality evolution over time
-
Distribution of non-conformities
-
Compliance rate by room type
Spot issues early — before they even show.
-
Statistical tracking of interventions
-
Real-time performance indicators
-
Generation of standardized reports compliant with ISO 9001 certified company requirements
-
Integration of artificial intelligence to assist in writing comments and recommendations
A reliable foundation to effectively manage quality and meet regulatory requirements:
Actionable Data to Improve Your Practices

Our other types of audits
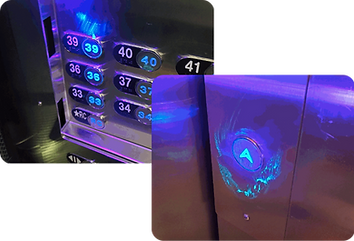
Fluorescence Audit
This visual and objective process helps verify the thoroughness of cleaning, raise staff awareness, and support a continuous quality improvement approach.
An invisible marker is applied to certain surfaces and then checked under a UV lamp after cleaning.
It allows validation of on-site safety procedures and equipment: PPE, WHMIS, training, etc.
OHS Audit

The Added Value for Your Facility
Objective Inspections
Clear Performance Tracking
Support for Decision-Making
Recognized by ISSA
HBcontrol is now the official software recognized by ISSA (International Sanitary Supply Association), the global benchmark organization for the cleaning and hygiene industry.
This recognition confirms the level of quality, objectivity, and performance achieved by our solution.
They Trust Us
